Leveraging Social Media Data for Real-time COVID-19 Prediction in Belgium
Introduction: The outbreak of the 2019 coronavirus (COVID-19) is one of the worst recorded in history. According to the Institute for Health Metrics and Evaluation (IHME) at the University of Washington, the true global death toll is more than double the reported figures. Countless people who die while contaminated with SARS-CoV-2 are never tested for it, so their counts are not included in the official totals. Therefore, it is nearly impossible to investigate all the symptoms of the infection by relying only on health records. To better understand the full spectrum of the prevalence of COVID-19 and the symptoms experienced by infected people and make further inferences regarding the spread of the infection among people, there is a need to look beyond hospital- or clinic-focused studies. Researchers have begun to explore the use of digital trace data, particularly data from social media platforms, as a means to predict the virus's spread in various communities. It is a particularly innovative approach, using publicly available social media data to track the spread of the disease in real time.
Problem Statement: Social media data has a potential application in the early identification of novel virus symptoms in digital epidemiology. It is a critical competency that public health organizations are investing in in order to receive real-time signals of pandemic upticks and spread. However, social media data is often unorganized and a non-representative sample of the population due to the demographic skew in usage frequencies and access rates. As such, any direct estimate from a platform like Twitter is likely biased toward certain demographics. With this in mind, an attempt is made to use tweets (digital trace data) to make inferences about the granular level prevalence of COVID-19 infections in Belgium. The goal of this study is to determine how this digital trace data, which is unstructured, non-representative, and biased, might be used to make inferences about the granular level prevalence of COVID-19 infections in Belgium.

Research Questions: Several key research questions guide this study:
• How is the mass-scaled digital trace data (tweets) collected?
• How is the unstructured digital trace data transformed into structured survey-like objects amenable to statistical analysis?
• How can these biased survey-like objects be utilized for generating representative real-time estimates of COVID-19 cases at the municipality level in Belgium?
Hypothesis: The area-level prevalence of the COVID-19 pandemic (in Belgium) at its granular level (municipalities) can be modeled by Multilevel Regression and Post-Stratification (MrP) on features extracted (like age and gender) from aggregated tweets of users from different municipalities of Belgium to make real-time predictions and generate representative estimates. The results of Multilevel Regression and Post-Stratification (MrP) are similar to actual data on the prevalence of COVID-19 infections in Belgium.
Methodology:
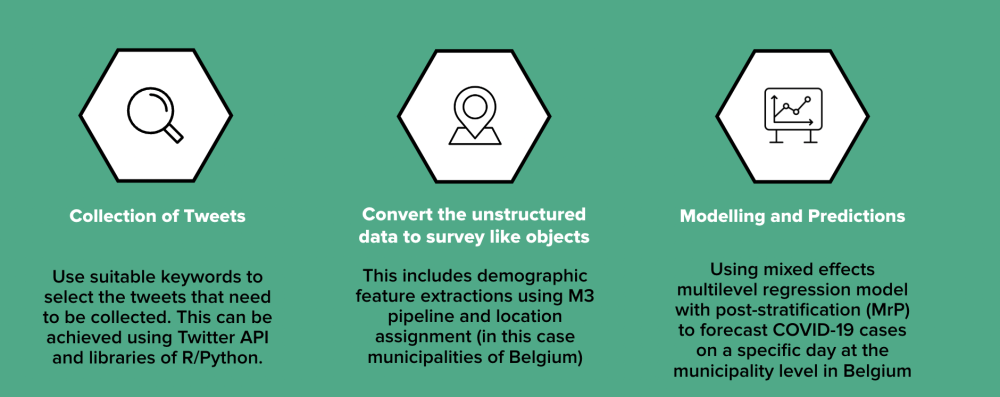
In this study, the following contributions are made to three core elements: collecting mass-scaled tweets, extracting demographic features and assigning a location value to convert unstructured digital data to survey-like objects, and using a multi-level regression model with post-stratification to make real-time predictions on the population using digital trace data.
The methodology comprises three main components:
- Data Collection:
- Tweets related to COVID-19 symptoms are collected from Twitter using specific keywords for a specific time range.
- Data Transformation:
- Demographic features such as age and gender are extracted from tweets using a deep learning model.
- Geolocation data for Belgian municipalities is obtained using sophisticated programming packages made available by Statbel.
- Statistical Analysis:
- A Multilevel Regression and Post-Stratification (MrP) model is employed to estimate COVID-19 prevalence based on demographic characteristics.
- Bayesian approaches using Stan and the 'rstan' package are used for modeling.
Results: A complete pipeline that includes the collection of social media data, converting it into organized survey-like objects, and finally fitting a mixed effects multi-level regression model with post-stratification (MrP) to forecast COVID-19 cases has been successfully built from scratch. The expectation from the model is not to make accurate predictions but to show that there is at least some correlation between the model estimates and the actual observed number of cases per municipality. Through that, the feasibility of the approach used in the study is established. The Pearson’s Correlation coefficient between the predictions based on the case count of January 23, 2022, from the model for the next day and the actual number of cases reported on January 24, 2022, is 0.938. This strong positive correlation is a very promising indication that there is an enormous signal in the Twitter data.
Discussions: This approach offers several advantages over traditional surveillance methods, including cost-effectiveness, real-time tracking, and user privacy protection. With no additional infrastructure requirements beyond a laptop and common software like R, Python, and Stan, it enables real-time tracking of the spread of diseases with data sourced from anonymous self-reported information online, eliminating the need for physical surveys. After processing, the data becomes completely anonymous, which protects user privacy. These advantages make social media monitoring an attractive research field for tracking epidemics, evaluating public health interventions, identifying high-risk areas, and identifying people who may require medical attention. Despite sampling bias and data limitations, it underscores the potential of social media monitoring in epidemiology and public health intervention. This has promising implications for real-time disease monitoring and control.
To the best of my knowledge, this is the first study in Belgium that focuses on extracting COVID-19 symptoms from public social media at the granular level of its municipalities to make inferences about the municipality-level spread of COVID-19 infections. Furthermore, not much work has been done with Belgian data using MrP. This study hopes to bridge that gap and encourage other scholars to pursue similar groundbreaking research.
Conclusion: A multitude of studies have been done as part of the reaction to this pandemic in an effort to improve our understanding and prevent the virus’s spread. The use of social media data to predict COVID-19 prevalence represents a novel strategy with valuable implications for public health authorities and the scientific community. In conclusion, it is suggested that this POC represents a very valuable source of information for the scientific community and public health authorities. This approach has the potential to make a significant contribution to the fight against any infectious disease, such as COVID-19, by accelerating the rate at which new cases are detected, using sources other than official data, and carrying out informed, targeted interventions to mitigate the spread of the disease.
Bibliografie
[1] Twitter API for Academic Research | Products.
[2] Epistat – COVID-19 Monitoring, 2021.
[3] Coronavirus disease (COVID-19), 04 2022.
[4] The pandemic’s true death toll: millions more than official counts, 01 2022.
[5] The Regions | Belgium.be, 04 2022.
[6] Sitaram Asur and Bernardo A. Huberman. Predicting the Future with Social Media. 2010
IEEE/WIC/ACM International Conference on Web Intelligence and Intelligent Agent Technology, 2010.
[7] Yan Bai, Lingsheng Yao, Tao Wei, Fei Tian, Dong-Yan Jin, Lijuan Chen, and Meiyun Wang. Presumed Asymptomatic Carrier Transmission of COVID-19. JAMA, 323(14):1406, 2020.
[8] Christopher Barrie and Justin Ho. academictwitteR: an R package to access the Twitter Academic Research Product Track v2 API endpoint. Journal of Open Source Software,6(62):3272, 2021.
[9] Johan Bollen, Huina Mao, and Xiaojun Zeng. Twitter mood predicts the stock market. Journal of Computational Science, 2(1):1–8, 2011.
[10] Samantha K Brooks, Rebecca K Webster, Louise E Smith, Lisa Woodland, Simon Wessely, Neil Greenberg, and Gideon James Rubin. The psychological impact of quarantine and how to reduce it: rapid review of the evidence. The Lancet, 395(10227):912–920, 2020.
[11] Owen Dyer. Covid-19: Study claims real global deaths are twice official figures. BMJ,page n1188, 2021.
[12] Gunther Eysenbach. Infodemiology and Infoveillance. American Journal of Preventive Medicine, 40(5):S154–S158, 2011.
[13] M. J. Greenacre. Influential analysis and presentation of survey data. Journal of Applied Statistics, 14(2):153–164, 1987.
[14] Wei-jie Guan, Zheng-yi Ni, Yu Hu, Wen-hua Liang, Chun-quan Ou, Jian-xing He, Lei Liu, Hong Shan, Chun-liang Lei, David SC Hui, Bin Du, Lan -juan Li, Guang Zeng,Kwok-Yung Yuen, Ru-chong Chen, Chun-li Tang, Tao Wang, Ping-yan Chen, Jie Xiang, Shi-yue Li, Jin-lin Wang, Zi-jing Liang, Yi- xiang Peng, Li Wei, Yong Liu, Ya-hua Hu,Peng Peng, Jian-ming Wang, Ji-yang Liu, Zhong Chen, Gang Li, Zhi-jian Zheng,Shao-qin Qiu, Jie Luo, Chang-jiang Ye , Shao-yong Zhu, and Nan-shan Zhong. Clinical Characteristics of Coronavirus Disease 2019 in China. New England Journal of Medicine, 382(18):1708–1720, 2020.
[15] Jia-Wen Guo, Christina L. Radloff, Sarah E. Wawrzynski, and Kristin G. Cloyes. Mining Twitter to explore the emergence of COVID-19 symptoms. Public Health Nursing,37(6):934–940, 2020.
[16] Chris Hanretty, Benjamin E. Lauderdale, and Nick Vivyan. Comparing Strategies for Estimating Constituency Opinion from National Survey Samples. Political Science Research and Methods, 6(3):571–591, 2016.
[17] Brent Hecht and Monica Stephens. A tale of cities: Urban biases in volunteered geographic information. In proceedings of the international AAAI conference on web and social media, volume 8, pages 197–205, 2014.
[18] Sepp Hochreiter and Jürgen Schmidhuber. Long short-term memory. Neural computation,9:1735–80, 12 1997.
[19] D. Holt and T. M. F. Smith. Post Stratification. Journal of the Royal Statistical Society.Series A (General), 142(1):33, 1979.
[20] Janet Ilieva, Steve Baron, and Nigel M. Healey. Online Surveys in Marketing Research.International Journal of Market Research, 44(3):1–14, 2002.
[21] Michael Kearney. rtweet: Collecting and analyzing Twitter data. Journal of Open SourceSoftware, 4(42):1829, 2019.
[22] Benjamin E. Lauderdale, Delia Bailey, Jack Blumenau, and Douglas Rivers. Model-based pre-election polling for national and sub-national outcomes in the US and UK. International Journal of Forecasting, 36(2):399–413, 2020.
[23] Jeffrey R. Lax and Justin H. Phillips. How Should We Estimate Public Opinion in The States? American Journal of Political Science, 53(1):107–121, 2009.
[24] Cuilian Li, Li Jia Chen, Xueyu Chen, Mingzhi Zhang, Chi Pui Pang, and Haoyu Chen.Retrospective analysis of the possibility of predicting the COVID-19 outbreak from Internet searches and social media data, China, 2020. Eurosurveillance, 25(10), 2020.
[25] R. J. A. Little. Post-Stratification: A Modeler’s Perspective. Journal of the American Statistical Association, 88(423):1001–1012, 1993.
[26] Jonathan Mellon and Christopher Prosser. Twitter and Facebook are not representative of the general population: Political attitudes and demographics of British social media users. Research amp; Politics, 4(3):205316801772000, 2017.
[27] Alan Mislove, Sune Lehmann, Yong yeol Ahn, Jukka pekka Onnela, and J. Niels Rosenquist. Understanding the demographics of twitter users. In In Proc. 5th International AAAI Conference on Weblogs and Social Media (ICWSM, 2011.
[28] Brendan O’Connor, Ramnath Balasubramanyan, Bryan R Routledge, and Noah A Smith.From tweets to polls: Linking text sentiment to public opinion time series. In Fourth International AAAI conference on weblogs and social media, 2010.
[29] David K. Park, Andrew Gelman, and Joseph Bafumi. Bayesian Multilevel Estimation with Poststratification: State-Level Estimates from National Polls. Political Analysis,12(4):375–385, 2004.[30] David K. Park, Andrew Gelman, and Joseph Bafumi. Bayesian Multilevel Estimation with Poststratification: State-Level Estimates from National Polls. Political Analysis,12(4):375–385, 2004.
[31] Seref Sagiroglu and Duygu Sinanc. Big data: A review. 2013 International Conference on Collaboration Technologies and Systems (CTS), 2013.
[32] Marcel Salathé. Digital epidemiology: what is it, and where is it going? Life Sciences,Society and Policy, 14(1), 2018.
[33] Nuhu A. Sansa. Effects of the COVID-19 Pandemic on the World Population: Lessons to Adopt from Past Years Global Pandemics. SSRN Electronic Journal, 2020.
[34] Abeed Sarker, Sahithi Lakamana, Whitney Hogg-Bremer, Angel Xie, Mohammed Ali Al-Garadi, and Yuan-Chi Yang. Self-reported COVID-19 symptoms on Twitter: Analysis and a research resource. Journal of the American Medical Informatics Association, 27(8):1310–1315, 2020.
[35] Soo-Yong Shin, Dong-Woo Seo, Jisun An, Haewoon Kwak, Sung-Han Kim, Jin Gwack,and Min-Woo Jo. High correlation of Middle East respiratory syndrome spread with Google search and Twitter trends in Korea. Scientific Reports, 6(1), 2016.
[36] Luke Sloan. Who Tweets in the United Kingdom? Profiling the Twitter Population Using the British Social Attitudes Survey 2015. Social Media + Society,3(1):205630511769898, 2017.
[37] The Economist. The pandemic’s true death toll, 02 2022.
[38] Abigail Walker, Claire Hopkins, and Pavol Surda. Use of Google Trends to investigate loss-of-smell–related searches during the COVID-19 outbreak. International Forum ofmAllergy amp; Rhinology, 10(7):839–847, 2020.
[39] Wei Wang, David Rothschild, Sharad Goel, and Andrew Gelman. Forecasting elections with non-representative polls. International Journal of Forecasting, 31(3):980–991, 2015.
[40] Zijian Wang, Scott Hale, David Ifeoluwa Adelani, Przemyslaw Grabowicz, Timo Hartman,Fabian Flöck, and David Jurgens. Demographic Inference and Representative Population Estimates from Multilingual Social Media Data. The World Wide Web Conference, 2019.
[41] James H. Watt. Internet systems for evaluation research. New Directions for Evaluation,1999(84):23–43, 1999.
[42] Emilio Zagheni, Ingmar Weber, and Krishna Gummadi. Leveraging Facebook’s Advertising Platform to Monitor Stocks of Migrants. Population and Development Review, 43(4):721–734, 2017.