
Het weerbericht voor 2059: verhalende wetenschap als drijfveer voor klimaatactie
Zonnig met maxima tot 42°
Het is juli 2059 en het is snikheet, maar lang niet zo heet als het vorige maand was. De gemiddelde globale temperatuur is intussen 2° boven pre-industriële niveaus gestegen. De langste hittegolf in de Belgische geschiedenis loopt stilaan ten einde, en zal uiteindelijk afklokken op 48 dagen. Het zijn 48 dagen die de geschiedenisboeken ingaan, dagen van zweten, nationale ellende en pure ernst. Het land is opgelucht door de dalende temperaturen, maar men weet nog niet dat er in augustus nog zo’n monsterhittegolf aankomt, tijdens welke het hitterecord in Ukkel voor een tweede maal dit jaar zal sneuvelen…

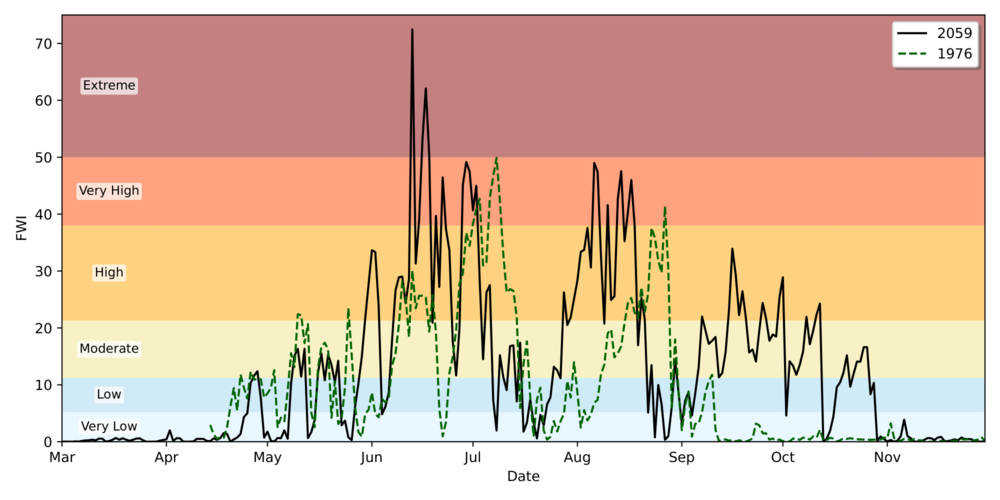
De Belgische natuurparken worden gedurende de hele zomer geteisterd door bosbranden. Op 15 juni waarschuwt Copernicus voor extreem brandgevaar over het volledige Vlaamse grondgebied. De voor die dag berekende Fire Weather Index, een numerieke indicator voor brandgevaar, neemt ter hoogte van de Kalmthoutse Heide een historische recordwaarde aan.
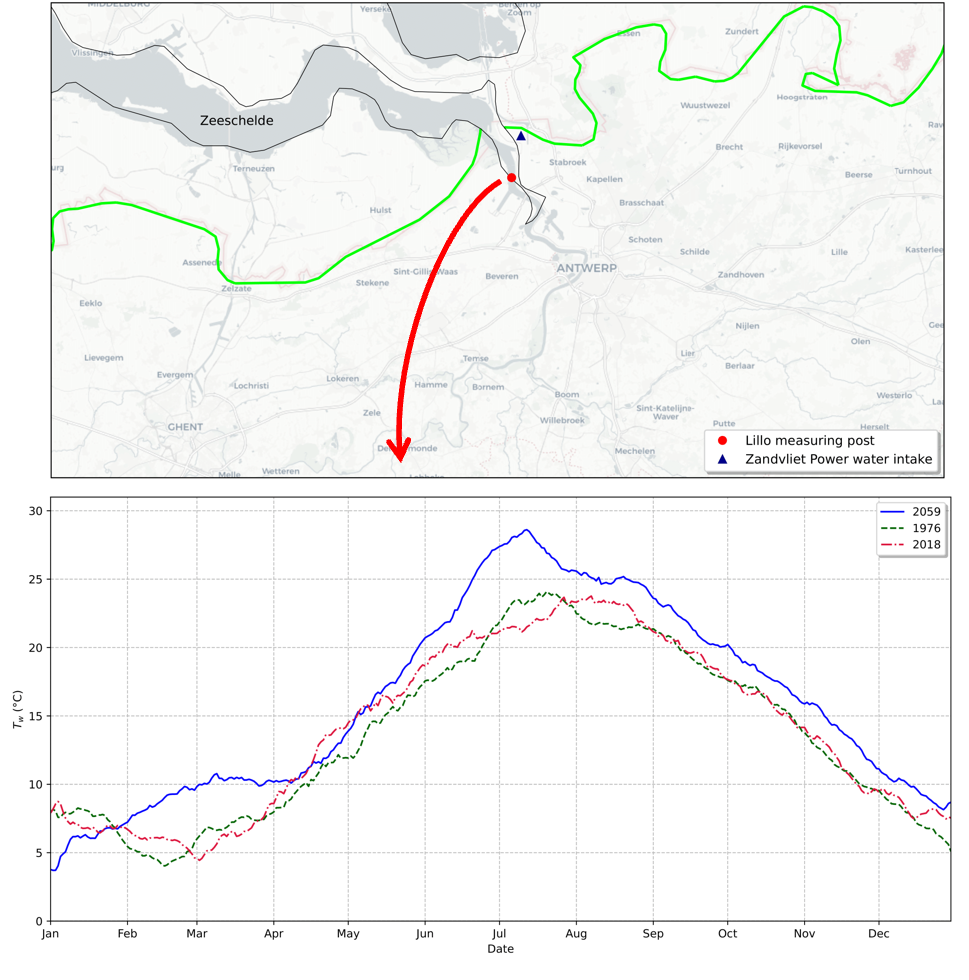
Ook de rivieren van ons land warmen op, wat nefast kan zijn voor biodiversiteit.
Meer nog, bij de energiecentrales van Doel maakt men zich zorgen over het feit dat het water van de Zeeschelde nog nooit zo warm is geweest, wat de efficiëntie van energieproductie kan beïnvloeden.
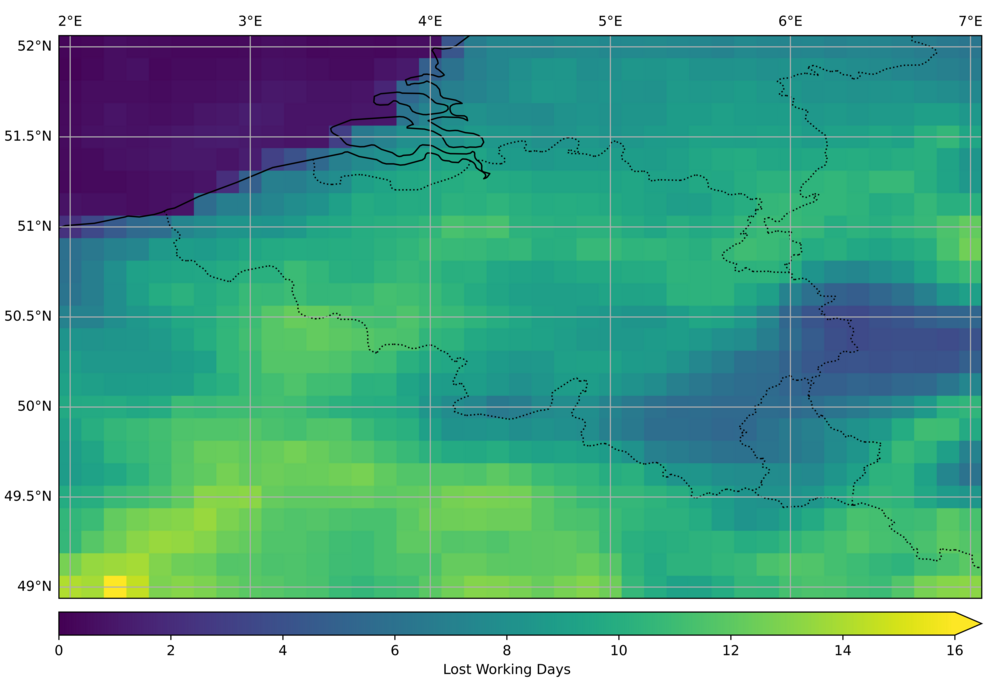
Die energie is nodig, want nog nooit was zo veel nood aan koeling van residentiële gebouwen. Reeds voor de officiële start van de zomer wordt de alarmfase van het federaal hitteplan afgekondigd, en er moeten onder andere maatregelen genomen worden op de werkvloer. Zwaar werk in open lucht, bijvoorbeeld op een bouwwerf, moet geregeld stilgelegd worden op basis van overschreden drempelwaarden voor de Wet Bulb Globe Temperature, een grootheid die de excessieve blootstelling van het menselijk lichaam aan extreme hitte in kaart brengt. Naar schatting verloren de bouw- en landbouwsectoren in de meeste Vlaamse steden hierdoor ongeveer 15 volledige werkdagen.
Landbouwers maken zich ook zorgen over een andere dreiging die de hoge temperaturen met zich meebrengen, namelijk een toename aan invasieve insectensoorten zoals de Bruingemarmerde stinkwants, die van hun gewassen een persoonlijk feestmaal maken en zo hun oogst in gevaar brengen. Volgens populatiemodellen had de Fruitvallei in Sint-Truiden te kampen met maar liefst drie generaties stinkwantsen.
Wetenschappers hebben intussen bestudeerd hoe deze zomer met haar twee hittegolven tot stand kon komen. Er werd een atmosferische blokkade boven de Baltische zee waargenomen. Dit is een weersituatie waarbij een

krachtig hogedrukgebied zich langdurig boven een bepaalde regio vestigt. Dit hogedrukgebied blokkeert de normale westelijke stroming, waardoor depressies en storingen niet langer gemakkelijk kunnen doorstromen. Het gevolg is dat stabiel en vaak droog weer dagen- tot wekenlang kan blijven hangen. In de dagen voor de sterkste pieken in temperatuur merken we ook een cycloon of lagedrukgebied ten westen van de Britse Eilanden. Deze cycloon is vermoedelijk verantwoordelijk voor de aanvoer van warme Afrikaanse lucht naar West-Europa.
Realiteit of fictie?
Laten we even terugkeren naar het heden. Wie dit leest vraagt zich wellicht af of de zomer van 2059 op de kalender gemarkeerd moet worden. Dat is natuurlijk niet het geval. Het bovenstaande is een voorbeeld van een zogenaamde storyline of tale of future weather; een wetenschappelijk onderbouwd narratief over een situatie die mogelijk wordt in een toekomstig, warmer klimaat. Maar als het niet echt is, fictie en geen voorspelling, wat is dan het punt?
Het is zo dat resultaten uit de klimaatwetenschap traditioneel gecommuniceerd en bestudeerd worden in termen van statistieken en probabiliteiten. Deze ruwe cijfers alleen resoneren echter vaak niet met beleidsmakers en het bredere publiek. De eerder vernoemde storylines vermijden die tekortkomingen van de probabilistische traditie, door de focus te verleggen van waarschijnlijkheid naar plausibiliteit. Ze kunnen de kloof overbruggen tussen abstracte wetenschap en door mensen beleefde extreme weersomstandigheden, waardoor klimaatverandering tastbaar, herkenbaar en concreet wordt. Met een klimaatverhaal zoals dat hierboven beantwoorden we bijvoorbeeld de vraag: Hoe erg kan een Belgische hittegolf worden indien we de kaap van 2° globale opwarming overschrijden? Deze informatie is nuttig voor heel wat mensen, omdat zij een duidelijk beeld krijgen van waarop men zich moet voorbereiden, en wat de zwakke plekken in beleid en infrastructuur zijn.
Nieuwe methode bedacht aan de Universiteit Gent
Zo’n storyline is heus niet verzonnen. Een thesisstudent aan de Universiteit Gent ontwikkelde een nieuwe methode om wetenschappelijk onderbouwde tales of future weather op te stellen. We laten hem even aan het woord: “Men gaat kijken naar de projecties van verschillende klimaatsimulaties over Europa. Dat zijn computermodellen die wetenschappers gebruiken om te voorspellen hoe het klimaat in Europa in de toekomst kan veranderen. Je kan het zien als een soort digitale weerkaart, maar dan niet voor de komende dagen, wel voor de komende decennia. Voor elke dag, soms zelfs elk uur, berekenen deze modellen hoeveel graden het wordt, hoeveel regen er valt, hoe hard de wind waait, enzovoort. Dat levert onvoorstelbare hoeveelheden gegevens, en deze gegevens kunnen we niet zomaar met de hand doorpluizen. Data-mining is een slimme manier om in die enorme berg cijfers te zoeken naar de interessante of relevante patronen, weerssituaties of klimaatfenomenen. In dit geval zijn we op zoek naar extreme-hittejaren: jaren waarin de warmte echt uitzonderlijk sterk is. Hiertoe bepalen we eerst een drempelwaarde: bijvoorbeeld een maximumtemperatuur. Als die in een bepaald jaar overschreden wordt, betekent het dat dat jaar bijzonder heet is. Die drempelwaarde is niet willekeurig gekozen. Ze wordt met een onze nieuwe methode – Global Warming Scaling - berekend die rekening houdt met het specifieke klimaat van de regio. Een drempel voor Zuid-Spanje is dus anders dan een drempel voor België of Scandinavië. Meer nog, we kunnen zo’n drempels ook gaan berekenen voor een toekomstig klimaat.”
Met de geselecteerde gegevens draaien de onderzoekers vervolgens lokale-impactmodellen, dat zijn wiskundige modellen die instaan voor de simulatie van hitte-impact op landbouw, oversterfte, brandgevaar, productiviteit op de werkvloer en nog meer. Deze modellen laten hen toe een beeld te schetsen van een toekomstige hittegolf in de vorm van een geloofwaardig verhaal, zoals het verhaal uit dit artikel.

Als het binnenkort 42° wordt, zullen we dus hopelijk goed voorbereid zijn.
Bibliografie
[1] A. Fischer, K. Strassmann, M. Croci-Maspoli, A. Hama, R. Knutti, S. Kotlarski, C. Schär, C. Schnadt Poberaj, N. Ban, M. Bavay, U. Beyerle, D. Bresch, S. Brönnimann, P. Burlando, A. Casanueva, S. Fatichi, I. Feigenwinter, E. Fischer, M. Hirschi, M. Liniger, C. Marty, I. Medhaug, N. Peleg, M. Pickl, C. Raible, J. Rajczak, O. Rössler, S. Scherrer, C. Schwierz, S. Seneviratne, M. Skelton, S. Sørland, C. Spirig, F. Tschurr, J. Zeder, and E. Zubler, “Climate Scenarios for Switzerland CH2018 – Approach and Implications,” Climate Services, vol. 26, 2022.
[2] GISTEMP Team, “GISS Surface Temperature Analysis (GISTEMP), Version 4,” 2025.
[3] F. Duchêne, B. V. Schaeybroeck, S. Caluwaerts, R. D. Troch, R. Hamdi, and P. Termonia, “A Statistical–Dynamical Methodology to Downscale Regional Climate Projections to Urban Scale,” Journal of Applied Meteorology and Climatology, vol. 59, no. 6, pp. 1109 – 1123, 2020.
[4] World Climate Research Programme (WCRP), “Coordinated Regional Climate Downscaling Experiment (CORDEX),” 2024.
[5] I. Lehtonen, K. Ruosteenoja, A. Venäläinen, and H. Gregow, “The Projected 21st Century Forest-Fire Risk in Finland Under Different Greenhouse Gas Scenarios,” 2014.
[6] United States Department of Agriculture (USDA), “Invasive.org,” 2018.
[7] K. Abbass, M. Z. Qasim, H. Song, M. Murshed, H. Mahmood, and I. Younis, “A Review of the Global Climate Change Impacts, Adaptation, and Sustainable Mitigation Measures,” Environmental Science and Pollution Research, vol. 29, pp. 42539–42559, Apr. 2022.
[8] Intergovernmental Panel on Climate Change (IPCC), Weather and Climate Extreme Events in a Changing Climate, p. 1513–1766. Cambridge University Press, 2023.
[9] M. Journée, E. Goudenhoofdt, S. Vannitsem, and L. Delobbe, “Quantitative Rainfall Analysis of the 2021 Mid-July Flood Event in Belgium,” Hydrology and Earth System Sciences, vol. 27, no. 17, pp. 3169–3189, 2023.
[10] Royal Meteorological Institute, “Dry Spring 2025,” 2025.
[11] K. van der Wiel, G. Lenderink, and H. de Vries, “Physical Storylines of Future European Drought Events Like 2018 Based on Ensemble Climate Modelling,” Weather and Climate Extremes, vol. 33, p. 100350, 2021.
[12] G. J. van Oldenborgh, K. van der Wiel, S. Kew, S. Philip, F. Otto, R. Vautard, A. King, F. Lott, J. Arrighi, R. Singh, and M. van Aalst, “Pathways and Pitfalls in Extreme Event Attribution,” Climatic Change, vol. 166, p. 13, May 2021.
[13] R. Vautard, J. Cattiaux, T. Happé, J. Singh, R. Bonnet, C. Cassou, D. Coumou, F. D’Andrea, D. Faranda, E. Fischer, A. Ribes, S. Sippel, and P. Yiou, “Heat Extremes in Western Europe Increasing Faster Than Simulated due to Atmospheric Circulation Trends,” Nature Communications, vol. 14, p. 6803, Oct 2023.
[14] D. G. Miralles, P. Gentine, S. I. Seneviratne, and A. J. Teuling, “Land–Atmospheric Feedbacks During Droughts and Heatwaves: State of the Science and Current Challenges,” Annals of the New York Academy of Sciences, vol. 1436, no. 1, pp. 19–35, 2019.
[15] Intergovernmental Panel on Climate Change (IPCC), “Climate Change 2023: Synthesis Report. Contribution of Working Groups I, II and III to the Sixth Assessment Report of the Intergovernmental Panel on Climate Change,” pp. 35–115, 2023.
[16] H. de Vries, G. Lenderink, E. van Meijgaard, B. van Ulft, and W. de Rooy, “Western Europe’s Extreme July 2019 Heatwave in a Warmer World,” Environmental Research: Climate, vol. 3, jun 2024.
[17] M. Rantanen, A. Y. Karpechko, A. Lipponen, K. Nordling, O. Hyvärinen, K. Ruosteenoja, T. Vihma, and A. Laaksonen, “The Arctic has Warmed Nearly Four Times Faster Than the Globe Since 1979,” Communications Earth & Environment, vol. 3, p. 168, Aug 2022.
[18] Z. Liu, W. Zhan, B. Bechtel, J. Voogt, J. Lai, T. Chakraborty, Z.-H. Wang, M. Li, F. Huang, and X. Lee, “Surface Warming in Global Cities is Substantially More Rapid Than in Rural Background Areas,” Communications Earth & Environment, vol. 3, p. 219, Sep 2022.
[19] Royal Meteorological Institute, De Evolutie van het Klimaat in België, pp. 4–32. D. Gellens, 2020.
[20] W. Hazeleger, B. J. J. M. van den Hurk, E. Min, G. J. van Oldenborgh, A. C. Petersen, D. A. Stainforth, E. Vasileiadou, and L. A. Smith, “Tales of Future Weather,” Nature Climate Change, vol. 5, pp. 107–113, Feb 2015.
[21] J. Sillmann, T. G. Shepherd, B. van den Hurk, W. Hazeleger, O. Martius, J. Slingo, and J. Zscheischler, “Event-Based Storylines to Address Climate Risk,” Earth’s Future, vol. 9, no. 2, 2021.
[22] T. G. Shepherd, “A Common Framework for Approaches to Extreme Event Attribution,” Current Climate Change Reports, vol. 2, pp. 28–38, Mar 2016.
[23] T. G. Shepherd, E. Boyd, R. A. Calel, S. C. Chapman, S. Dessai, I. M. Dima-West, H. J. Fowler, R. James, D. Maraun, O. Martius, C. A. Senior, A. H. Sobel, D. A. Stainforth, S. F. B. Tett, K. E. Trenberth, B. J. J. M. van den Hurk, N. W. Watkins, R. L. Wilby, and D. A. Zenghelis, “Storylines: an Alternative Approach to Representing Uncertainty in Physical Aspects of Climate Change,” Climatic Change, vol. 151, pp. 555–571, Dec 2018.
[24] A. Ciullo, O. Martius, E. Strobl, and D. N. Bresch, “A Framework for Building Climate Storylines Based on Downward Counterfactuals: The Case of the European Union Solidarity Fund,” Climate Risk Management, vol. 33, p. 100349, 2021.
[25] S. E. Perkins-Kirkpatrick, L. V. Alexander, A. D. King, S. F. Kew, S. Y. Philip, C. Barnes, D. Maraun, R. F. Stuart-Smith, A. Jézéquel, E. Bevacqua, S. Burgess, E. Fischer, G. C. Hegerl, J. Kimutai, G. Koren, K. A. Lawal, S.-K. Min, M. New, R. C. Odoulami, C. M. Patricola, I. Pinto, A. Ribes, T. A. Shaw, W. Thiery, B. Trewin, R. Vautard, M. Wehner, and J. Zscheischler, “Frontiers in Attributing Climate Extremes and Associated Impacts,” Frontiers in Climate, vol. 6, 2024.
[26] B. J. van den Hurk, M. Baldissera Pacchetti, E. Boere, A. Ciullo, L. Coulter, S. Dessai, E. Ercin, H. M. Goulart, R. Hamed, S. Hochrainer-Stigler, E. Koks, P. Kubiczek, A. Levermann, R. Mechler, M. van Meersbergen, B. Mester, R. Middelanis, K. Minderhoud, J. Mysiak, S. Nirandjan, G. van den Oord, C. Otto, P. Sayers, J. Schewe, T. G. Shepherd, J. Sillmann, D. Stuparu, T. Vogt, and K. Witpas, “Climate Impact Storylines for Assessing Socio-Economic Responses to Remote Events,” Climate Risk Management, vol. 40, p. 100500, 2023.
[27] E. M. Fischer, U. Beyerle, L. Bloin-Wibe, C. Gessner, V. Humphrey, F. Lehner, A. G. Pendergrass, S. Sippel, J. Zeder, and R. Knutti, “Storylines for Unprecedented Heatwaves Based on Ensemble Boosting,” Nature Communications, vol. 14, p. 4643, Aug 2023.
[28] P. Ailliot, D. Allard, V. Monbet, and P. Naveau, “Stochastic Weather Generators: an Overview of Weather Type Models,” Journal de la société française de statistique, vol. 156, no. 1, pp. 101–113, 2015.
[29] P. Yiou, “AnaWEGE: a Weather Generator Based on Analogues of Atmospheric Circulation,” Geoscientific Model Development, vol. 7, no. 2, pp. 531–543, 2014.
[30] P. Yiou and A. Jézéquel, “Simulation of Extreme Heat Waves With Empirical Importance Sampling,” Geoscientific Model Development, vol. 13, no. 2, pp. 763–781, 2020.
[31] P. Pfleiderer, A. Jézéquel, J. Legrand, N. Legrix, I. Markantonis, E. Vignotto, and P. Yiou, “Simulating Compound Weather Extremes Responsible for Critical Crop Failure With Stochastic Weather Generators,” Earth System Dynamics, vol. 12, no. 1, pp. 103–120, 2021.
[32] M. I. Brunner, E. Gilleland, and A. W. Wood, “Space-Time Dependence of Compound Hot-Dry Events in the United States: Assessment Using a Multi-Site Multi-Variable Weather Generator,” Earth System Dynamics, vol. 12, no. 2, pp. 621–634, 2021.
[33] T. Schreiber and A. Schmitz, “Surrogate Time Series,” Physica D: Nonlinear Phenomena, vol. 142, no. 3, pp. 346–382, 2000.
[34] C. Schär, C. Frei, D. Lüthi, and H. C. Davies, “Surrogate Climate-Change Scenarios for Regional Climate Models,” Geophysical Research Letters, vol. 23, no. 6, pp. 669–672, 1996.
[35] P. Yiou, R. Vautard, Y. Robin, N. de Noblet-Ducoudré, F. D’Andrea, and R. Noyelle, “How Could 50 °C be Reached in Paris: Analyzing the CMIP6 Ensemble to Design Storylines for Adaptation,” Climate Services, vol. 36, p. 100518, 2024.
[36] J. Bessembinder, R. Bintanja, R. van Dorland, C. Homan, B. Overbeek, F. Selten, and P. Siegmund, “KNMI’23-Klimaatscenario’s voor Nederland,” tech. rep., Royal Netherlands Meteorological Institute, 2023.
[37] Royal Meteorological Institute, “Verwachtingen voor 5 juli 2063,” 2019.
[38] C. Bertrand, R. Ingels, and M. Journée, “Homogenization and Trends Analysis of the Belgian Historical Precipitation Time Series,” International Journal of Climatology, vol. 41, no. 11, pp. 5277–5294, 2021.
[39] M. J. Menne, C. N. Williams Jr., and M. A. Palecki, “On the Reliability of the U.S. Surface Temperature Record,” Journal of Geophysical Research: Atmospheres, vol. 115, 2010.
[40] C. Bertrand, V. Vrábel, C. Delvaux, M. Alioscha-Perez, and H. Sahli, “BEL-HORNET: Belgian Homogenized Long-Term Reference Climate Time Series,” tech. rep., Belgian Science Policy Office, 2018.
[41] C. Delvaux, R. Ingels, V. Vrábel, M. Journée, and C. Bertrand, “Quality Control and Homogenization of the Belgian Historical Temperature Data,” International Journal of Climatology, vol. 39, no. 1, pp. 157–171, 2019.
[42] J. Hansen, R. Ruedy, M. Sato, and K. Lo, “Global Surface Temperature Change,” Reviews of Geophysics, vol. 48, no. 4, 2010.
[43] N. Lenssen, G. A. Schmidt, M. Hendrickson, P. Jacobs, M. J. Menne, and R. Ruedy, “A NASA GISTEMPv4 Observational Uncertainty Ensemble,” Journal of Geophysical Research: Atmospheres, vol. 129, no. 17, 2024.
[44] Vlaamse Overheid, “Waterinfo,” 2025.
[45] Waterinfo, “Watertemperaturen – Lillo Meetpaal.” Accessed: May 2025.
[46] R. C. Cornes, G. van der Schrier, E. J. M. van den Besselaar, and P. D. Jones, “An Ensemble Version of the E-OBS Temperature and Precipitation Data Sets,” Journal of Geophysical Research: Atmospheres, vol. 123, no. 17, pp. 9391–9409, 2018.
[47] Copernicus Climate Change Service, Climate Data Store, “E-OBS Daily Gridded Meteorological Data for Europe From 1950 to Present Derived From In-Situ Observations,” 2020.
[48] European Climate Assessment Dataset, “Daily Data,” 2025.
[49] European Centre for Medium-Range Weather Forecasts (ECMWF), “ECMWF Reanalysis v5 (ERA5),” 2024.
[50] J. Muñoz Sabater, “ERA5-Land Hourly Data From 1950 to Present. Copernicus Climate Change Service (C3S) Climate Data Store (CDS),” 2019.
[51] J. Monteith and M. Unsworth, Principles of Environmental Physics: Plants, Animals, and the Atmosphere. Academic Press, 2013.
[52] J. Holton and G. Hakim, An Introduction to Dynamic Meteorology. International Geophysics, Academic Press, 2012.
[53] M. Auffhammer, S. M. Hsiang, and W. Schlenker, “Global Climate Models and Climate Data: A User Guide for Economists,” 2011.
[54] R. L. Wilby, J. Troni, Y. Biot, L. Tedd, B. C. Hewitson, D. M. Smith, and R. T. Sutton, “A Review of Climate Risk Information for Adaptation and Development Planning,” International Journal of Climatology, vol. 29, no. 9, pp. 1193–1215, 2009.
[55] P. Termonia, B. Van Schaeybroeck, L. De Cruz, R. De Troch, S. Caluwaerts, O. Giot, R. Hamdi, S. Vannitsem, F. Duchêne, P. Willems, H. Tabari, E. Van Uytven, P. Hosseinzadehtalaei, N. Van Lipzig, H. Wouters, S. Vanden Broucke, J.-P. van Ypersele, P. Marbaix, C. Villanueva-Birriel, X. Fettweis, C. Wyard, C. Scholzen, S. Doutreloup, K. De Ridder, A. Gobin, D. Lauwaet, T. Stavrakou, M. Bauwens, J.-F. Müller, P. Luyten, S. Ponsar, D. Van den Eynde, and E. Pottiaux, “The CORDEX.be Initiative as a Foundation for Climate Services in Belgium,” Climate Services, vol. 11, pp. 49–61, 2018.
[56] L. R. Leung, Regional Climate Models, pp. 8902–8919. New York, NY: Springer New York, 2012.
[57] Z. Xu, Y. Han, and Z. Yang, “Dynamical Downscaling of Regional Climate: A Review of Methods and Limitations,” Science China Earth Sciences, vol. 62, pp. 365–375, Feb 2019.
[58] W. C. R. P. (WCRP), “Coordinated Regional Climate Downscaling Experiment - European Domain (EURO-CORDEX),” 2024.
[59] E. Katragkou, S. P. Sobolowski, C. Teichmann, F. Solmon, V. Pavlidis, D. Rechid, P. Hoffmann, J. Fernandez, G. Nikulin, and D. Jacob, “Delivering an Improved Framework for the New Generation of CMIP6-Driven EURO-CORDEX Regional Climate Simulations,” Bulletin of the American Meteorological Society, vol. 105, no. 6, 2024.
[60] D. Jacob, C. Teichmann, S. Sobolowski, E. Katragkou, I. Anders, M. Belda, R. Benestad, F. Boberg, E. Buonomo, R. M. Cardoso, A. Casanueva, O. B. Christensen, J. H. Christensen, E. Coppola, L. De Cruz, E. L. Davin, A. Dobler, M. Dominguez, R. Fealy, J. Fernandez, M. A. Gaertner, M. García-Díez, F. Giorgi, A. Gobiet, K. Goergen, J. J. Gómez-Navarro, J. J. G. Alemán, C. Gutiérrez, J. M. Gutiérrez, I. Güttler, A. Haensler, T. Halenka, S. Jerez, P. Jiménez-Guerrero, R. G. Jones, K. Keuler, E. Kjellström, S. Knist, S. Kotlarski, D. Maraun, E. van Meijgaard, P. Mercogliano, J. P. Montávez, A. Navarra, G. Nikulin, N. de Noblet-Ducoudré, H.-J. Panitz, S. Pfeifer, M. Piazza, E. Pichelli, J.-P. Pietikäinen, A. F. Prein, S. Preuschmann, D. Rechid, B. Rockel, R. Romera, E. Sánchez, K. Sieck, P. M. M. Soares, S. Somot, L. Srnec, S. L. Sørland, P. Termonia, H. Truhetz, R. Vautard, K. Warrach-Sagi, and V. Wulfmeyer, “Regional Climate Downscaling Over Europe: Perspectives From the EURO-CORDEX Community,” Regional Environmental Change, vol. 20, p. 51, Apr 2020.
[61] R. Moss, M. Babiker, S. Brinkman, E. Calvo, T. Carter, J. Edmonds, I. Elgizouli, S. Emori, E. Lin, K. Hibbard, R. Jones, M. Kainuma, J. Kelleher, J.-F. Lamarque, M. Manning, B. Matthews, J. Meehl, L. Meyer, J. Mitchell, and M. Zurek, “Towards New Scenarios for Analysis of Emissions, Climate Change, Impacts, and Response Strategies. Technical Summary,” 2008.
[62] C. Schwingshackl, A. S. Daloz, C. Iles, K. Aunan, and J. Sillmann, “High-Resolution Projections of Ambient Heat for Major European Cities Using Different Heat Metrics,” Natural Hazards and Earth System Sciences, vol. 24, no. 1, pp. 331–354, 2024.
[63] E. Coppola, R. Nogherotto, J. M. Ciarlo, F. Giorgi, E. van Meijgaard, N. Kadygrov, C. Iles, L. Corre, M. Sandstad, S. Somot, P. Nabat, R. Vautard, G. Levavasseur, C. Schwingshackl, J. Sillmann, E. Kjellström, G. Nikulin, E. Aalbers, G. Lenderink, O. B. Christensen, F. Boberg, S. L. Sørland, M.-E. Demory, K. Bülow, C. Teichmann, K. Warrach-Sagi, and V. Wulfmeyer, “Assessment of the European Climate Projections as Simulated by the Large EURO-CORDEX Regional and Global Climate Model Ensemble,” Journal of Geophysical Research: Atmospheres, vol. 126, no. 4, 2021.
[64] V. Eyring, S. Bony, G. A. Meehl, C. A. Senior, B. Stevens, R. J. Stouffer, and K. E. Taylor, “Overview of the Coupled Model Intercomparison Project Phase 6 (CMIP6) Experimental Design and Organization,” Geoscientific Model Development, vol. 9, no. 5, pp. 1937–1958, 2016.
[65] “The CMIP6 landscape,” Nature Climate Change, vol. 9, pp. 727–727, Oct 2019.
[66] F. Duchêne, R. Hamdi, B. Van Schaeybroeck, S. Caluwaerts, R. De Troch, L. de Cruz, and P. Termonia, “Downscaling Ensemble Climate Projections to Urban Scale: Brussels’s Future Climate at 1.5 °C, 2 °C, and 3 °C Global Warming,” Urban Climate, vol. 46, p. 101319, 2022.
[67] V. Masson, P. Le Moigne, E. Martin, S. Faroux, A. Alias, R. Alkama, S. Belamari, A. Barbu, A. Boone, F. Bouyssel, P. Brousseau, E. Brun, J.-C. Calvet, D. Carrer, B. Decharme, C. Delire, S. Donier, K. Essaouini, A.-L. Gibelin, H. Giordani, F. Habets, M. Jidane, G. Kerdraon, E. Kourzeneva, M. Lafaysse, S. Lafont, C. Lebeaupin Brossier, A. Lemonsu, J.-F. Mahfouf, P. Marguinaud, M. Mokhtari, S. Morin, G. Pigeon, R. Salgado, Y. Seity, F. Taillefer, G. Tanguy, P. Tulet, B. Vincendon, V. Vionnet, and A. Voldoire, “The SURFEXv7.2 Land and Ocean Surface Platform for Coupled or Offline Simulation of Earth Surface Variables and Fluxes,” Geoscientific Model Development, vol. 6, no. 4, pp. 929–960, 2013.
[68] Ghent University, “The Vlinder Project,” 2018.
[69] J. Finkel and P. A. O’Gorman, “Bringing Statistics to Storylines: Rare Event Sampling for Sudden, Transient Extreme Events,” Journal of Advances in Modeling Earth Systems, vol. 16, no. 6, 2024.
[70] P. Yiou, C. Cadiou, D. Faranda, A. Jézéquel, N. Malhomme, G. Miloshevich, R. Noyelle, F. Pons, Y. Robin, and M. Vrac, “Ensembles of Climate Simulations to Anticipate Worst Case Heatwaves During the Paris 2024 Olympics,” npj Climate and Atmospheric Science, vol. 6, p. 188, Nov 2023.
[71] S. Coles, An Introduction to Statistical Modeling of Extreme Values. Springer Series in Statistics, Springer London, 2013.
[72] C. Navarro-Racines, J. Tarapues, P. Thornton, A. Jarvis, and J. Ramirez-Villegas, “High-Resolution and Bias-Corrected CMIP5 Projections for Climate Change Impact Assessments,” Scientific Data, vol. 7, Jan 2020.
[73] D. Maraun, “Bias Correcting Climate Change Simulations - a Critical Review,” Current Climate Change Reports, vol. 2, pp. 211–220, Dec 2016.
[74] R. Vautard, P. Yiou, Y. Robin, N. de Noblet, F. d’Andrea, and L. Abbadie, “Simulations de Scénarios ‘Paris 50°C’,” tech. rep., GREC francilien, June 2023.
[75] C. H. Simpson, O. Brousse, and C. Heaviside, “Estimated Mortality Attributable to the Urban Heat Island During the Record-Breaking 2022 Heatwave in London,” Environmental Research Letters, vol. 19, aug 2024.
[76] E. Hawkins, D. Frame, L. Harrington, M. Joshi, A. King, M. Rojas, and R. Sutton, “Observed Emergence of the Climate Change Signal: From the Familiar to the Unknown,” Geophysical Research Letters, vol. 47, no. 6, 2020.
[77] Z. Zhong, B. He, H. W. Chen, D. Chen, T. Zhou, W. Dong, C. Xiao, S.-p. Xie, X. Song, L. Guo, R. Ding, L. Zhang, L. Huang, W. Yuan, X. Hao, D. Ji, and X. Zhao, “Reversed Asymmetric Warming of Sub-Diurnal Temperature Over Land During Recent Decades, journal=Nature Communications,” vol. 14, p. 7189, Nov 2023.
[78] T. R. Karl, P. D. Jones, R. W. Knight, G. Kukla, N. Plummer, V. Razuvayev, K. P. Gallo, J. Lindseay, R. J. Charlson, and T. C. Peterson, “A New Perspective on Recent Global Warming: Asymmetric Trends of Daily Maximum and Minimum Temperature,” Bulletin of the American Meteorological Society, vol. 74, no. 6, pp. 1007 – 1024, 1993.
[79] Q.-V. Doan, F. Chen, Y. Asano, Y. Gu, A. Nishi, H. Kusaka, and D. Niyogi, “Causes for Asymmetric Warming of Sub-Diurnal Temperature Responding to Global Warming,” Geophysical Research Letters, vol. 49, no. 20, 2022.
[80] Y. Dodge, The Concise Encyclopedia of Statistics. Springer New York, 2008.
[81] H. B. Mann and D. R. Whitney, “On a Test of Whether one of Two Random Variables is Stochastically Larger Than the Other,” The Annals of Mathematical Statistics, vol. 18, no. 1, pp. 50 – 60, 1947.
[82] M. DeGroot and M. Schervish, Probability and Statistics. Addison-Wesley, 2012.
[83] N. Smirnov, “Table for Estimating the Goodness of Fit of Empirical Distributions,” The Annals of Mathematical Statistics, vol. 19, no. 2, pp. 279 – 281, 1948.
[84] D. Knuth, The Art of Computer Programming: Seminumerical Algorithms, Volume 2. Pearson Education, 2014.
[85] R. S. Kovats and S. Hajat, “Heat Stress and Public Health: a Critical Review,” Annual Review of Public Health, vol. 29, no. Volume 29, 2008, pp. 41–55, 2008.
[86] K. Parsons, Human Thermal Environments: the Effects of Hot, Moderate, and Cold Environments on Human Health, Comfort and Performance. CRC press, 2007.
[87] T. Kjellstrom, “Climate Change, Direct Heat Exposure, Health and Well-Being in Low and Middle-Income Countries,” Global Health Action, vol. 2, no. 1, p. 1958, 2009.
[88] J. C. Liljegren, R. A. Carhart, P. Lawday, S. Tschopp, and R. Sharp, “Modeling the Wet Bulb Globe Temperature Using Standard Meteorological Measurements,” Journal of Occupational and Environmental Hygiene, vol. 5, no. 10, pp. 645–655, 2008.
[89] B. Lemke and T. Kjellstrom, “Calculating Workplace WBGT From Meteorological Data: A Tool for Climate Change Assessment,” Industrial Health, vol. 50, no. 4, pp. 267–278, 2012.
[90] Q. Kong and M. Huber, “Explicit Calculations of Wet-Bulb Globe Temperature Compared With Approximations and Why It Matters for Labor Productivity,” Earth’s Future, vol. 10, no. 3, 2022.
[91] T. Kjellstrom, I. Holmer, and B. Lemke, “Workplace Heat Stress, Health and Productivity – an Increasing Challenge for Low and Middle-Income Countries During Climate Change,” Global Health Action, vol. 2, no. 1, p. 2047, 2009.
[92] A. Casanueva, S. Kotlarski, A. M. Fischer, A. D. Flouris, T. Kjellstrom, B. Lemke, L. Nybo, C. Schwierz, and M. A. Liniger, “Escalating Environmental Summer Heat Exposure - a Future Threat for the European Workforce,” Regional Environmental Change, vol. 20, p. 40, Mar 2020.
[93] “ISO 7243: Ergonomics of the Thermal Environment—Assessment of Heat Stress Using the WBGT (Wet Bulb Globe Temperature) Index,” tech. rep., International Organization for Standardization, 2017.
[94] P. Bröde, D. Fiala, B. Lemke, and T. Kjellstrom, “Estimated Work Ability in Warm Outdoor Environments Depends on the Chosen Heat Stress Assessment Metric,” International Journal of Biometeorology, vol. 62, pp. 331–345, Mar 2018.
[95] M. C. Almeida and P. S. Coelho, “Modeling River Water Temperature With Limiting Forcing Data: Air2stream v1.0.0, Machine Learning and Multiple Regression,” Geoscientific Model Development, vol. 16, no. 14, pp. 4083–4112, 2023.
[96] F. Petrakopoulou, A. Robinson, and M. Olmeda-Delgado, “Impact of Climate Change on Fossil Fuel Power-Plant Efficiency and Water Use,” Journal of Cleaner Production, vol. 273, p. 122816, 2020.
[97] F. Petrakopoulou, “Defining the Cost of Water Impact for Thermoelectric Power Generation,” Energy Reports, vol. 7, pp. 2101–2112, 2021.
[98] H. Koch and S. Vögele, “Dynamic Modelling of Water Demand, Water Availability and Adaptation Strategies for Power Plants to Global Change,” Ecological Economics, vol. 68, no. 7, pp. 2031–2039, 2009.
[99] A. Rabi, M. Hadzima-Nyarko, and M. Sperac, “Modelling River Temperature From Air Temperature: Case of the River Drava (Croatia),” Hydrological Sciences Journal, vol. 60, no. 9, pp. 1490–1507, 2015.
[100] R. Kruk, J. Van Geertsom, A. Royen, and N. Bourland, “Is Belgium Ready for More Frequent and Intense Wildfires? Analysis of the Belgian State of Play and Insights From the International Context,” tech. rep., Climate Risk Assessment Center and National Geographic Institute, 2025.
[101] B. Lawson and O. Armitage, “Weather Guide for the Canadian Forest Fire Danger Rating System,” Natural Resources Canada, 2008.
[102] M. Kogan and R. Prokopy, “Chapter 3 - Agricultural Entomology,” in Encyclopedia of Insects (V. H. Resh and R. T. Cardé, eds.), San Diego: Academic Press, second edition ed., 2009.
[103] P. C. Tobin, S. Nagarkatti, G. Loeb, and M. C. Saunders, “Historical and Projected Interactions Between Climate Change and Insect Voltinism in a Multivoltine Species,” Global Change Biology, vol. 14, no. 5, pp. 951–957, 2008.
[104] O. H. Berteloot, A. Kuhn, G. Peusens, T. Beliën, L. Hautier, T. V. Leeuwen, and P. D. Clercq, “Distribution and Genetic Diversity of the Invasive Pest Halyomorpha halys (Hemiptera, Pentatomidae) in Belgium,” NeoBiota, vol. 90, pp. 123–138, 2024.
[105] EPPO Global Database, “First Report of Popillia japonica in Switzerland,” 2017.
[106] European Parliament, “Discovery of Pest ‘False Codling Moth’ on Fruit From Morocco,” 2023.
[107] European Commission, “Commission Delegated Regulation (EU) 2019/1702 of 1 August 2019 Supplementing Regulation (EU) 2016/2031 of the European Parliament and of the Council by Establishing the List of Priority Pests,” 2019.
[108] D. Kriticos, G. Maywald, T. Yonow, E. Zurcher, N. Herrmann, and B. Sutherst, “CLIMEX Version 4: Exploring the Effects of Climate on Plants, Animals and Diseases,” 2016.
[109] D. J. Kriticos, J. M. Kean, C. B. Phillips, S. D. Senay, H. Acosta, and T. Haye, “The Potential Global Distribution of the Brown Marmorated Stink Bug, Halyomorpha halys, a Critical Threat to Plant Biosecurity,” Journal of Pest Science, vol. 90, pp. 1033–1043, Sep 2017.
[110] E. J. Kistner-Thomas, “The Potential Global Distribution and Voltinism of the Japanese Beetle (Coleoptera: Scarabaeidae) Under Current and Future Climates,” Journal of Insect Science, vol. 19, no. 2, p. 16, 2019.
[111] B. Barker and L. Coop, “False Codling Moth (Thaumatotibia leucotreta) (Lepidoptera: Tortricidae): Phenology/Degree-Day and Climate Suitability Model Analysis for USPEST.ORG,” 2019. Prepared for USDA APHIS PPQ.
[112] J. Van Nieuwenhuyse, B. Van Schaeybroeck, S. Caluwaerts, J. De Deyn, A. Delcloo, R. De Troch, R. Hamdi, and P. Termonia, “Air-Stagnation Episodes Based on Regional Climate Models Part I: Evaluation Over Europe,” Climate Dynamics, vol. 61, pp. 2121–2138, Sep 2023.
[113] J. O. Anderson, J. G. Thundiyil, and A. Stolbach, “Clearing the Air: A Review of the Effects of Particulate Matter Air Pollution on Human Health,” Journal of Medical Toxicology, vol. 8, pp. 166–175, Jun 2012.
[114] World Health Organization, “Review of Evidence on Health Aspects of Air Pollution – REVIHAAP Project: Technical Report,” tech. rep., World Health Organization Regional Office for Europe, 2013.
[115] A. P. K. Tai, M. V. Martin, and C. L. Heald, “Threat to Future Global Food Security From Climate Change and Ozone Air Pollution,” Nature Climate Change, vol. 4, pp. 817–821, Sep 2014.
[116] D. E. Horton, Harshvardhan, and N. S. Diffenbaugh, “Response of Air Stagnation Frequency to Anthropogenically Enhanced Radiative Forcing,” Environmental Research Letters, vol. 7, nov 2012.
[117] E. Elnagar, S. Gendebien, E. Georges, U. Berardi, S. Doutreloup, and V. Lemort, “Framework to Assess Climate Change Impact on Heating and Cooling Energy Demands in Building Stock: A Case Study of Belgium in 2050 and 2100,” Energy and Buildings, vol. 298, p. 113547, 2023.
[118] D. Crawley, “EnergyPlus: A New-Generation Building Energy Simulation Program,” 1999.
[119] R. Guglielmetti, D. Macumber, and N. Long, “OpenStudio: An Open Source Integrated Analysis Platform; Preprint,” National Renewable Energy Lab. (NREL), 2011.
[120] P. K. Dunn, “Bootstrap Confidence Intervals for Predicted Rainfall Quantiles,” International Journal of Climatology, vol. 21, no. 1, pp. 89–94, 2001.
[121] J. L. Horowitz, “Bootstrap Methods in Econometrics,” Annual Review of Economics, vol. 11, pp. 193–224, 2019.
[122] Royal Netherlands Meteorological Institute, “Nederland Warmt Ruim 2 Keer zo Snel op als de Wereldgemiddelde Temperatuur,” 2021.
[123] Royal Meteorological Institute, “Juli 2019: Absolute Warmterecord Gebroken,” 2019.
[124] FOD Volksgezondheid, Veiligheid van de Voedselketen en Leefmilieu, “Ozon- en Hitteplan,” 2019.
[125] Royal Meteorological Institute, “Legend Heat,” 2025.
[126] Royal Meteorological Institute, “Klimaatnormalen te Ukkel,” 2025.
[127] Royal Meteorological Institute, “Klimatologische Overzichten van 2024,” 2024.
[128] L. Schepers, B. Haest, S. Veraverbeke, T. Spanhove, J. Vanden Borre, and R. Goossens, “Burned Area Detection and Burn Severity Assessment of a Heathland Fire in Belgium Using Airborne Imaging Spectroscopy (APEX),” Remote Sensing, vol. 6, no. 3, pp. 1803–1826, 2014.
[129] A. Depicker, B. De Baets, and J. M. Baetens, “Wildfire Ignition Probability in Belgium,” Natural Hazards and Earth System Sciences, vol. 20, no. 2, pp. 363–376, 2020.
[130] Copernicus Emergency Management Service, The European Forest Fire Information System: User Guide to EFFIS Applications, May 2018. Version 2.3.3.
[131] A. Mastai, “Storylines of Future Climate Extremes in Switzerland,” April 2022.
[132] P. Yiou, D. Faranda, S. Thao, and M. Vrac, “Projected Changes in the Atmospheric Dynamics of Climate Extremes in France,” Atmosphere, vol. 12, no. 11, 2021.
[133] C. C. Ibebuchi and I.-O. Abu, “Characterization of Temperature Regimes in Western Europe, as Regards the Summer 2022 Western European Heat Wave,” Climate Dynamics, vol. 61, pp. 3707–3720, Oct 2023.
[134] S. Y. Philip, S. F. Kew, G. J. van Oldenborgh, F. S. Anslow, S. I. Seneviratne, R. Vautard, D. Coumou, K. L. Ebi, J. Arrighi, R. Singh, M. van Aalst, C. Pereira Marghidan, M. Wehner, W. Yang, S. Li, D. L. Schumacher, M. Hauser, R. Bonnet, L. N. Luu, F. Lehner, N. Gillett, J. S. Tradowsky, G. A. Vecchi, C. Rodell, R. B. Stull, R. Howard, and F. E. L. Otto, “Rapid Attribution Analysis of the Extraordinary Heat Wave on the Pacific Coast of the US and Canada in June 2021,” Earth System Dynamics, vol. 13, no. 4, pp. 1689–1713, 2022.
[135] L. Bloin-Wibe, R. Noyelle, V. Humphrey, U. Beyerle, R. Knutti, and E. Fischer, “Estimating Return Periods for Extreme Events in Climate Models Through Ensemble Boosting,” EGUsphere, vol. 2025, pp. 1–40, 2025.
[136] L. Corre, A. Ribes, S. Bernus, A. Drouin, S. Morin, and J.-M. Soubeyroux, “Using Regional Warming Levels to Describe Future Climate Change for Services and Adaptation: Application to the French Reference Trajectory for Adaptation,” Climate Services, vol. 38, p. 100553, 2025.
[137] D. L. Schumacher, J. Singh, M. Hauser, E. M. Fischer, M. Wild, and S. I. Seneviratne, “Exacerbated Summer European Warming not Captured by Climate Models Neglecting Long-Term Aerosol Changes,” Communications Earth & Environment, vol. 5, p. 182, Apr 2024.
[138] C. Simolo and S. Corti, “Enhanced Risk of Hot Extremes Revealed by Observation-Constrained Model Projections,” Communications Earth & Environment, vol. 6, p. 165, Feb 2025.
[139] H. Tabari, S. M. Paz, D. Buekenhout, and P. Willems, “Comparison of Statistical Downscaling Methods for Climate Change Impact Analysis on Precipitation-Driven Drought,” Hydrology and Earth System Sciences, vol. 25, no. 6, pp. 3493–3517, 2021.
[140] M. R. Leadbetter, “Extremes and Local Dependence in Stationary Sequences,” Zeitschrift für Wahrscheinlichkeitstheorie und Verwandte Gebiete, vol. 65, pp. 291–306, Dec 1983.
[141] A. Dierickx, “Precipitation Extremes in Regional and Convection-Permitting Climate Models: Validation and Future Projections,” June 2024.
[142] J. Hosking and J. Wallis, “Parameter and Quantile Estimation for the Generalized Pareto Distribution,” Technometrics, vol. 29, no. 3, pp. 339–349, 1987.
[143] A. L. Buck, “New Equations for Computing Vapor Pressure and Enhancement Factor,” Journal of Applied Meteorology and Climatology, vol. 20, no. 12, pp. 1527 – 1532, 1981.
[144] C. H. Bedingfield and T. B. Drew, “Analogy Between Heat Transfer and Mass Transfer,” Industrial & Engineering Chemistry, vol. 42, pp. 1164–1173, Jun 1950.
[145] C. van Wagner and T. Pickett, “Equations and FORTRAN Program for the Canadian Forest Fire Weather Index System,” tech. rep., 1985.
[146] C. van Wagner, “Development and Structure of the Canadian Forest Fire Weather Index System,” tech. rep., 1987.