Wie sluit zijn CO₂ als eerste aan? Het kip-of-eiprobleem ontward
Wie sluit zijn CO₂ als eerste aan?
Het kip-of-eiprobleem ontward
In de Antwerpse haven liggen de eerste leidingen voor een gedeeld CO₂-netwerk al in de grond, en het publieke geld is vrijgemaakt. Maar de deelname van grote klanten blijft onzeker. Ik simuleerde 227 industriële sites om te zien waarom die eerste stap zo moeilijk is. Beslissend is niet zozeer hoeveel bedrijven aansluiten, maar welke — en hoe de rekening wordt verdeeld.
In maart 2025 stelde chemiereus BASF zijn beslissing over Kairos@C uit. Daarmee wilden BASF en Air Liquide jaarlijks ongeveer een miljoen ton CO₂ afvangen en opslaan, als eerste grote klant van het gedeelde netwerk. Zonder BASF komen ook de afvangplannen van andere chemiebedrijven in het gedrang, schreef De Tijd. Intussen trok Vlaanderen 1,2 miljard euro uit voor CO₂-afvang en opslag (CCS), maar over Kairos@C beslist BASF wellicht pas in 2027.
Hoe kan één aarzelend bedrijf een hele haven ophouden?
Waarheen met afgevangen CO₂?
Cement, staal, chemie en raffinaderijen halen nooit nuluitstoot met efficiëntie alleen: een deel van hun CO₂ ontstaat in het proces zelf. CCS is voor hen een van de weinige manieren om te decarboniseren en competitief te blijven. Maar afvangen is slechts één schakel van de waardeketen. Daarna moet de CO₂ ergens heen: voorgoed onder de Noordzee, of naar een bedrijf dat ze gebruikt.
Zoals een bus met twee passagiers
Stel je een cementfabriek voor die haar CO₂ wil afvangen. Ze heeft een pijpleiding nodig, en die kost ongeveer evenveel of er nu weinig of veel doorheen stroomt. Hoe meer CO₂, hoe goedkoper per ton: schaalvoordelen. Vergelijk het met een private busmaatschappij die voor twee passagiers peperdure tickets moet vragen.
Zo moet ook een CO₂-netbeheerder hoge tarieven aanrekenen zolang maar enkele industriële sites meedoen. Een klassiek kip-of-eiprobleem: de leiding is duur omdat ze weinig wordt gebruikt, en blijft weinig gebruikt omdat ze duur is. Elke industriële site rekent voor zichzelf, terwijl de aansluiting de rekening van alle anderen verlaagt. Ergens tussen leeg en vol ligt een drempel. Haalt iemand die ooit?
Een coördinatiepuzzel
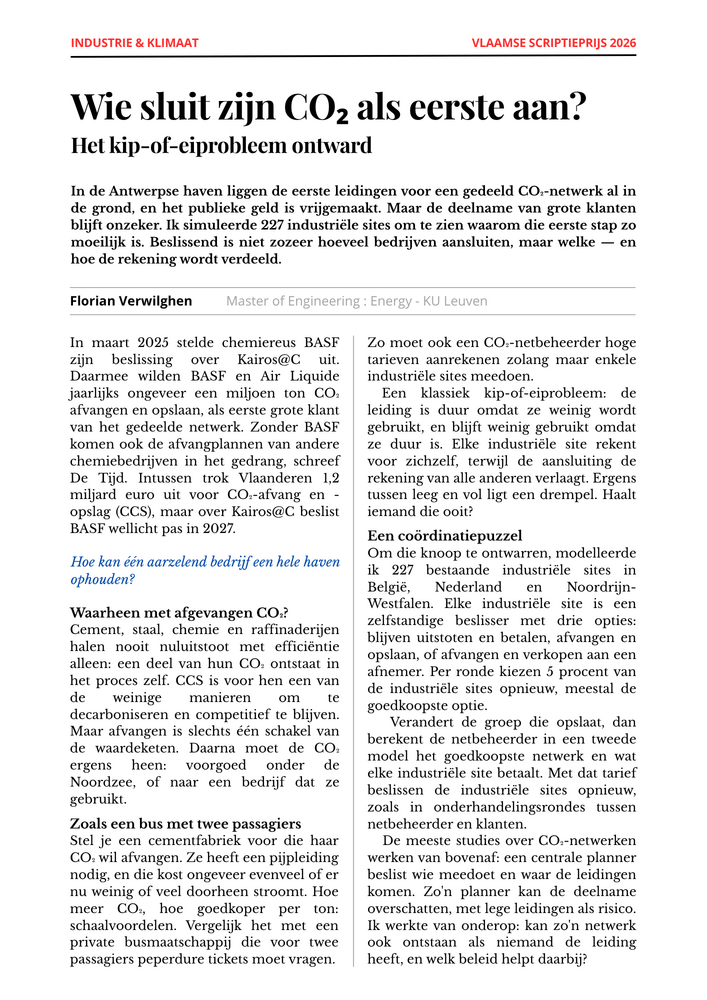
Om die knoop te ontwarren, modelleerde ik 227 bestaande industriële sites in België, Nederland en NoordrijnWestfalen. Elke industriële site is een zelfstandige beslisser met drie opties: blijven uitstoten en betalen, afvangen en opslaan, of afvangen en verkopen aan een afnemer. Per ronde kiezen 5 procent van de industriële sites opnieuw, meestal de goedkoopste optie.
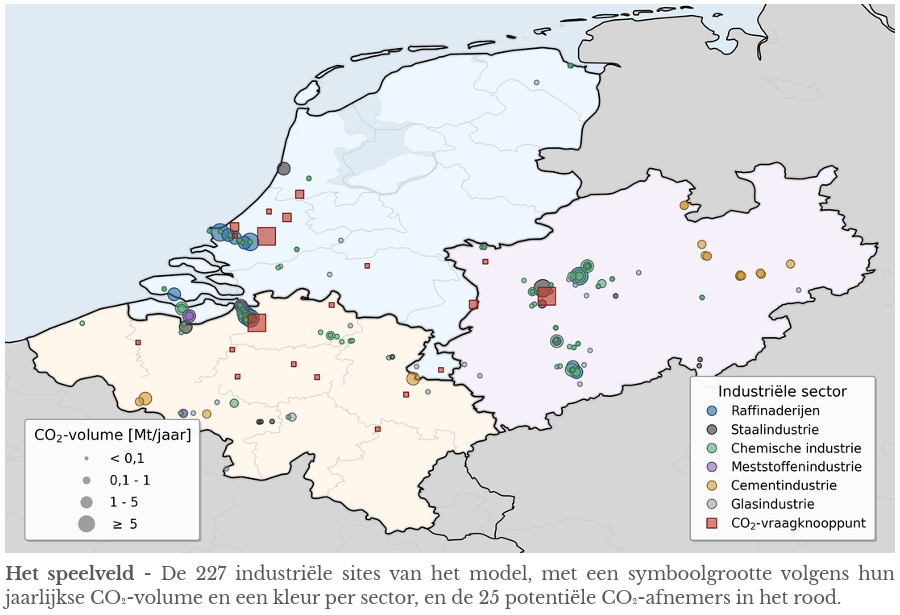
Verandert de groep die opslaat, dan berekent de netbeheerder in een tweede model het goedkoopste netwerk en wat elke industriële site betaalt. Met dat tarief beslissen de industriële sites opnieuw, zoals in onderhandelingsrondes tussen netbeheerder en klanten.
De meeste studies over CO₂-netwerken werken van bovenaf: een centrale planner beslist wie meedoet en waar de leidingen komen. Zo'n planner kan de deelname overschatten, met lege leidingen als risico. Ik werkte van onderop: kan zo'n netwerk ook ontstaan als niemand de leiding heeft, en welk beleid helpt daarbij?
Drie industriële sites doen het systeem kantelen

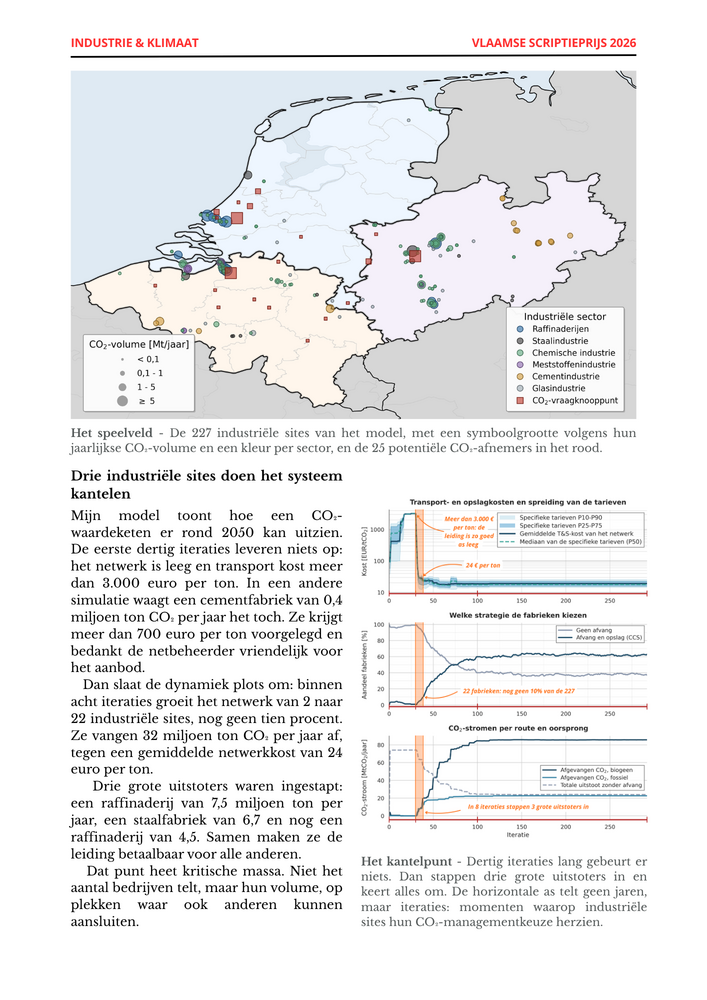
Mijn model toont hoe een CO₂waardeketen er rond 2050 kan uitzien. De eerste dertig iteraties leveren niets op: het netwerk is leeg en transport kost meer dan 3.000 euro per ton. In een andere simulatie waagt een cementfabriek van 0,4 miljoen ton CO₂ per jaar het toch. Ze krijgt meer dan 700 euro per ton voorgelegd en bedankt de netbeheerder vriendelijk voor het aanbod.
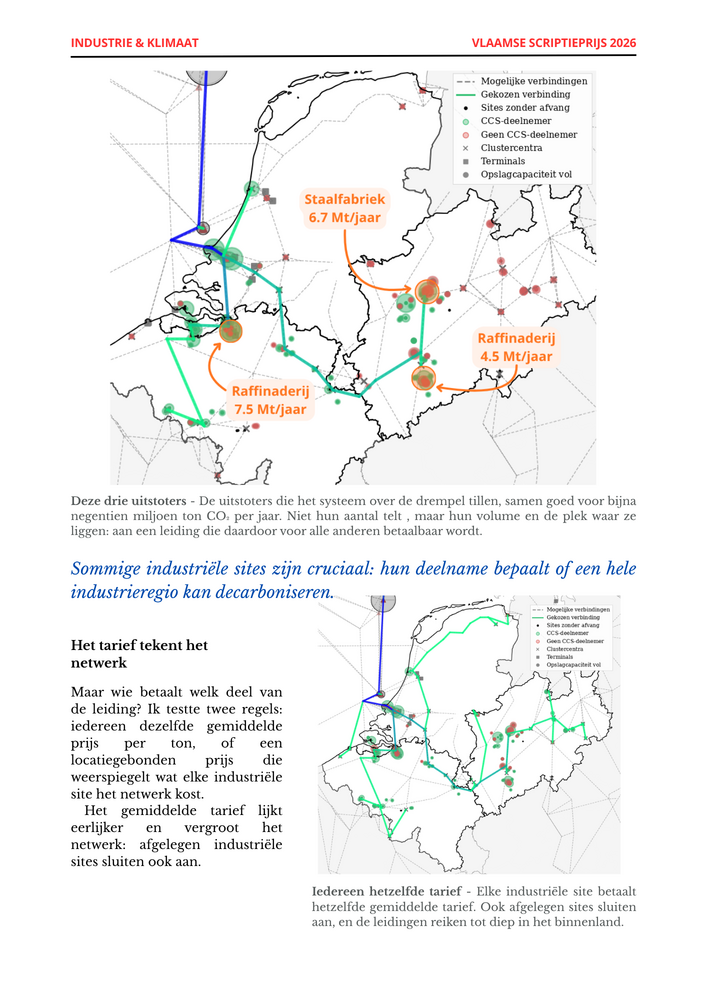
Dan slaat de dynamiek plots om: binnen acht iteraties groeit het netwerk van 2 naar 22 industriële sites, nog geen tien procent. Ze vangen 32 miljoen ton CO₂ per jaar af, tegen een gemiddelde netwerkkost van 24 euro per ton.
Drie grote uitstoters waren ingestapt: een raffinaderij van 7,5 miljoen ton per jaar, een staalfabriek van 6,7 en nog een raffinaderij van 4,5. Samen maken ze de leiding betaalbaar voor alle anderen. Dat punt heet kritische massa. Niet het aantal bedrijven telt, maar hun volume, op plekken waar ook anderen kunnen aansluiten.
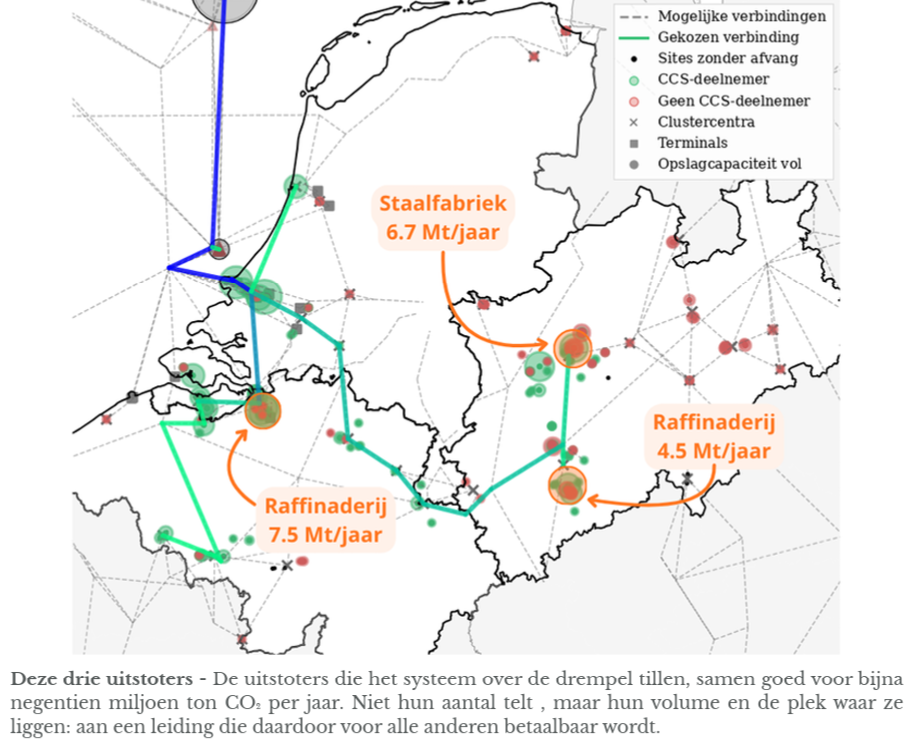
Sommige industriële sites zijn cruciaal: hun deelname bepaalt of een hele industrieregio kan decarboniseren.
Het tarief tekent het netwerk 
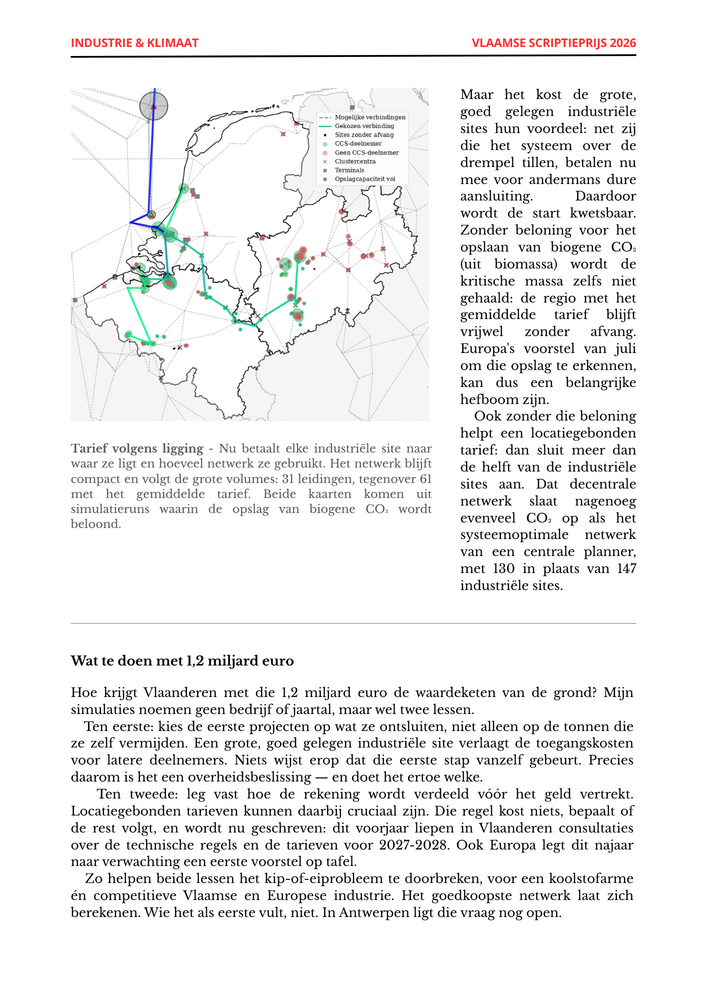
Maar wie betaalt welk deel van de leiding? Ik testte twee regels: iedereen dezelfde gemiddelde prijs per ton, of een locatiegebonden prijs die weerspiegelt wat elke industriële site het netwerk kost. Het gemiddelde tarief lijkt eerlijker en vergroot het netwerk: afgelegen industriële sites sluiten ook aan.

Maar het kost de grote, goed gelegen industriële sites hun voordeel: net zij die het systeem over de drempel tillen, betalen nu mee voor andermans dure aansluiting. Daardoor wordt de start kwetsbaar. Zonder beloning voor het opslaan van biogene CO₂ (uit biomassa) wordt de kritische massa zelfs niet gehaald: de regio met het gemiddelde tarief blijft vrijwel zonder afvang. Europa's voorstel van juli om die opslag te erkennen, kan dus een belangrijke hefboom zijn.
Ook zonder die beloning helpt een locatiegebonden tarief: dan sluit meer dan de helft van de industriële sites aan. Dat decentrale netwerk slaat nagenoeg evenveel CO₂ op als het systeemoptimale netwerk van een centrale planner, met 130 in plaats van 147 industriële sites.
Wat te doen met 1,2 miljard euro
Hoe krijgt Vlaanderen met die 1,2 miljard euro de waardeketen van de grond? Mijn simulaties noemen geen bedrijf of jaartal, maar wel twee lessen.
Ten eerste: kies de eerste projecten op wat ze ontsluiten, niet alleen op de tonnen die ze zelf vermijden. Een grote, goed gelegen industriële site verlaagt de toegangskosten voor latere deelnemers. Niets wijst erop dat die eerste stap vanzelf gebeurt. Precies daarom is het een overheidsbeslissing — en doet het ertoe welke.
Ten tweede: leg vast hoe de rekening wordt verdeeld vóór het geld vertrekt. Locatiegebonden tarieven kunnen daarbij cruciaal zijn. Die regel kost niets, bepaalt of de rest volgt, en wordt nu geschreven: dit voorjaar liepen in Vlaanderen consultaties over de technische regels en de tarieven voor 2027-2028. Ook Europa legt dit najaar naar verwachting een eerste voorstel op tafel.
Zo helpen beide lessen het kip-of-eiprobleem te doorbreken, voor een koolstofarme én competitieve Vlaamse en Europese industrie. Het goedkoopste netwerk laat zich berekenen. Wie het als eerste vult, niet. In Antwerpen ligt die vraag nog open.
Bibliografie
[1] AB InBev. Belgium locations. AB InBev Europe Careers, 2026. Accessed: 2026-05-07.
[2] M. Akhurst, P. Brownsort, N. Burnside, R. S. Haszeldine, G. Johnson, C. Littlecott, P. Parmiter, V. Scott, G. Sim, and J. Stewart. SCCS Recommendations and Conference 2013 Executive Summary: Unlocking North Sea CO2 Storage for Europe: Practical Actions for the Next Five Years. Technical report, Scottish Carbon Capture and Storage, 2013.
[3] Argus Media. Argus biomass markets. Technical report, Argus Media, 2025.
[4] W. B. Arthur. Competing technologies, increasing returns, and lock-in by historical events. The Economic Journal, 99(394):116–131, 1989.
[5] M. Ashkavand, M. Scheffler, W. Heineken, M. D. Solomon, and T. BirthReichert. Techno-economic assessment of liquefied CO2 transport via trucking. International Journal of Greenhouse Gas Control, 147:104491, 2025.
[6] V. Auletta, D. Ferraioli, F. Pasquale, P. Penna, and G. Persiano. Convergence to equilibrium of logit dynamics for strategic games. Algorithmica, 76(1):110142, 2016.
[7] L. E. Blume. The statistical mechanics of strategic interaction. Games and Economic Behavior, 5(3):387–424, 1993.
[8] Business in Antwerp. Europe’s largest integrated chemical cluster: A hub of innovation and sustainability. Business in Antwerp, 2026. Accessed: 2026-05-07.
[9] Chemelot. Chemelot climate neutral by 2050. Chemelot, 2020. Accessed: 202605-07.
[10] Chemiepark Marl. The marl chemical park. Chemiepark Marl, 2026. Accessed: 2026-05-07.
[11] CHEMPARK. Facts. CHEMPARK, 2026. Accessed: 2026-05-07.
[12] City of Ghent and North Sea Port. Towards a new carbon-neutral economy in the ghent area of north sea port: Exploratory study for a ccu hub. Technical report, City of Ghent, 2019. Accessed: 2026-05-07.
[13] CO2 Value Europe. The contribution of carbon capture and utilisation (ccu) towards climate neutrality in europe: An eu roadmap for ccu by 2050. Technical report, CO2 Value Europe, 2024. Accessed: 2026-05-07.
[14] Coca-Cola Europacific Partners. 2024 cdp corporate questionnaire. Technical report, Coca-Cola Europacific Partners, 2024. Accessed: 2026-05-07.
[15] CURRENTA. Company. CURRENTA, 2026. Accessed: 2026-05-07.
[16] M. Cătut, i and D. Vangenechten. The european commission’s industrial carbon management strategy provides technocratic answers to an unfinished political debate.
[17] De Tijd. Zonder basf komt ook CO2-afvang van andere chemiebedrijven in gedrang.
[18] European Biogas Association. Biogenic co2 from biogases. Technical report, European Biogas Association, 2025. Includes European CO2 market data based on S&P Global Commodity Insights (2024). Accessed: 2026-05-07.
[19] European Commission. Just transition platform project fiche: Chemelot circular hub. Technical report, European Commission, 2023. Accessed: 2026-05-07.
[20] European Commission. Industrial Carbon Management Strategy. Technical Report Comm. 52024DC0062, European Commission, 2024.
[21] European Commission, Joint Research Centre. AIDRES- Advancing industrial decarbonization by assessing the future use of renewable energies in industrial processes. JRC Data Catalogue, 2026. Accessed: 2026-05-11.
[22] Evonik. Marl. Evonik Worldwide Locations, 2026. Accessed: 2026-05-07.
[23] G. Faber, A. W. Ruttinger, T. Strunge, T. Langhorst, A. Zimmermann, M. van der Hulst, F. Bensebaa, S. M. Moni, L. Tao, G. Guillén-Gosálbez, S. Suh, S. McCord, P. Styring, and V. Sick. Adapting technology learning curves for prospective techno-economic and life cycle assessments of emerging carbon capture and utilization pathways. Frontiers in Climate, 4:820261, 2022.
[24] Fluxys. Fluxys belgium, north sea port and arcelormittal belgium receive eu funding for ghent carbon hub study. Fluxys Press Release, 2022. Accessed: 2026-05-07.
[25] Glastuinbouw Nederland. Co2-voorziening. Glastuinbouw Nederland, 2026. Accessed: 2026-05-07.
[26] Glastuinbouw Nederland. Greenports. Glastuinbouw Nederland, 2026. Accessed: 2026-05-07.
[27] R. Golombek, M. Greaker, S. Kverndokk, and L. Ma. The transition to carbon capture and storage technologies. Technical Report Working Paper 9047, CESifo, 2021. [28] Greenports Nederland. Regionale greenports. Greenports Nederland, 2026. Accessed: 2026-05-07.
[29] V. Grimm, U. Berger, F. Bastiansen, S. Eliassen, V. Ginot, J. Giske, J. GossCustard, T. Grand, S. K. Heinz, G. Huse, A. Huth, J. U. Jepsen, C. Jørgensen, W. M. Mooij, B. Müller, G. Pe’er, C. Piou, S. F. Railsback, A. M. Robbins, M. M. Robbins, E. Rossmanith, N. Rüger, E. Strand, S. Souissi, R. A. Stillman, R. Vabø, U. Visser, and D. L. DeAngelis. A standard protocol for describing individual-based and agent-based models. Ecological Modelling, 198(1–2):115126, 2006.
[30] V. Grimm, U. Berger, D. L. DeAngelis, J. G. Polhill, J. Giske, and S. F. Railsback. The odd protocol: A review and first update. Ecological Modelling, 221(23):2760–2768, 2010.
[31] Heineken Nederland. Onze brouwerijen. Heineken Nederland, 2026. Accessed: 2026-05-07.
[32] S.-H. Hwang and L. Rey-Bellet. Positive feedback in coordination games: Stochastic evolutionary dynamics and the logit choice rule. Games and Economic Behavior, 126:355–373, 2021.
[33] International Association of Oil & Gas Producers (IOGP). The potential for CCS and CCU in europe. Technical report, IOGP, 2019. Madrid Forum report.
[34] IPCC. Good practice guidance for land use, land-use change and forestry. Technical report, Intergovernmental Panel on Climate Change, 2003.
[35] IPCC. 2006 ipcc guidelines for national greenhouse gas inventories: Volume 2, chapter 6, reference approach. Technical report, Intergovernmental Panel on Climate Change, 2006.
[36] A. Itul, A. Diaz Rincon, O. D. Eulaerts, A. Georgakaki, M. Grabowska, Z. Kapetaki, E. Ince, S. Letout, A. Kuokkanen, A. Mountraki, D. Shtjefni, and M. Jaxa-Rozen. Clean energy technology observatory: Carbon capture utilisation and storage in the european union– 2023 status report on technology development, trends, value chains and markets. Technical report, Publications Office of the European Union, Luxembourg, 2023. JRC134999. Accessed: 2026-05-07.
[37] L. R. Izquierdo, S. S. Izquierdo, and W. H. Sandholm. Agent-Based Evolutionary Game Dynamics: A Guide. 2024. Book.
[38] Kas als Energiebron. Co2-voorziening. Kas als Energiebron, 2026. Accessed: 2026-05-07.
[39] J.-S. Lee, T. Filatova, A. Ligmann-Zielinska, B. Hassani-Mahmooei, F. Stonedahl, I. Lorscheid, A. Voinov, J. G. Polhill, Z. Sun, and D. C. Parker. The complexities of agent-based modeling output analysis. Journal of Artificial Societies and Social Simulation, 18(4):4, 2015.
[40] K. Lin, N. Wei, D. Jiang, and Y. Zhang. Progress and perspectives in sourcesink matching for CCUS: A critical review. Renewable and Sustainable Energy Reviews, 226:116313, 2026.
[41] A. Mahler and E. M. Rogers. The diffusion of interactive communication innovations and the critical mass: the adoption of telecommunications services by german banks. Telecommunications Policy, 23(10–11):719–740, 1999.
[42] MarketDataForecast. Europe carbon dioxide market size, share, trends and growth forecast report, 2025–2033. MarketDataForecast, 2025. Commercial market report used only as a short-to-medium-term growth proxy. Accessed: 2026-05-07.
[43] C. G. Martinez et al. Clean energy technology observatory: Carbon capture, utilisation and storage in the european union– 2024 status report on technology development, trends, value chains and markets. Technical report, Publications Office of the European Union, Luxembourg, 2024. JRC139285. Accessed: 202605-07.
[44] R. D. McKelvey and T. R. Palfrey. Quantal response equilibria for normal form games. Games and Economic Behavior, 10(1):6–38, 1995.
[45] S. Nie, G. Cai, Y. Li, Y. Chen, R. Bai, L. Gao, and X. Chen. To adopt CCU technology or not? an evolutionary game between local governments and coalfired power plants. Sustainability, 14(8):4768, 2022.
[46] NRW.Global Business. Business location nrw: Europe’s heartbeat. NRW.Global Business, 2026. Accessed: 2026-05-07.
[47] Port of Antwerp-Bruges. Chemicals. Port of Antwerp-Bruges, 2026. Accessed: 2026-05-07.
[48] Port of Moerdijk. Industrial park moerdijk. Port of Moerdijk, 2026. Accessed: 2026-05-07.
[49] Port of Rotterdam. Storage and use of co2. Port of Rotterdam, 2026. Accessed: 2026-05-07.
[50] Porthos. Co2 reduction through storage under the north sea. Porthos, 2026. Accessed: 2026-05-07.
[51] N. Poulsen, S. Holloway, F. Neele, N. A. Smith, and K. Kirk. CO2StoP Final Report. Assessment of CO2 Storage Potential in Europe. European Commission Contract No ENER/C1/154-2011-SI2.611598, volume 2014 of Danmarks og Grønlands Geologiske Undersøgelse Rapport. GEUS, Copenhagen, 2014.
[52] M. A. Rahmanta, B. M. Sopha, and A. M. Sri Asih. Modeling and optimization of carbon capture, utilization, and storage networks: A review of mathematical approaches. Energy Reports, 15:109162, 2026.
[53] S. F. Railsback and V. Grimm. Agent-Based and Individual-Based Modeling: A Practical Introduction. Princeton University Press, 2 edition, 2019.
[54] E. S. Rubin, I. M. L. Azevedo, P. Jaramillo, and S. Yeh. A review of learning rates for electricity supply technologies. Energy Policy, 86:198–218, 2015.
[55] E. S. Rubin, S. Yeh, M. Antes, M. Berkenpas, and J. Davison. Use of experience curves to estimate the future cost of power plants with CO2 capture. International Journal of Greenhouse Gas Control, 1(2):188–197, 2007.
[56] D. Schüwer, K. Arnold, K. Bienge, et al. Co2 reuse nrw: Evaluating gas sources, demand and utilization for co2 and h2 within the north rhine-westphalia area with respect to gas qualities. Technical report, Wuppertal Institute for Climate, Environment and Energy, 2015. Accessed: 2026-05-07.
[57] A. Sneyd, S. Chan, A. Mitchell, J. Howes, and S. Baltac. CO2 Transport for e-Fuels Production in Europe. Technical report, Transport & Environment, 2025.
[58] K. D. P. Storrs, I. Lyhne, and R. Drustrup. A comprehensive framework for feasibility of CCUS deployment. International Journal of Greenhouse Gas Control, 125:103878, 2023.
[59] G. van der Laan and A. F. Tieman. Evolutionary game theory and the modeling of economic behavior. De Economist, 146(1):59–89, 1998.
[60] N. J. A. van der Velden and P. X. Smit. Co2-behoefte glastuinbouw 2030. Technical report, Wageningen Economic Research, 2019. Accessed: 2026-05-07.
[61] F. Verbist, J. Meus, J. A. Moncada, P. Valkering, and E. Delarue. Implications of the EU ETS on the level-playing field between CCS & CCU. International Journal of Greenhouse Gas Control, 136:104165, 2024.
[62] F. Verbist, J. Meus, P. Valkering, and E. Delarue. Unravelling co2 value chain participation under negative emission pricing and eu industry relocation, 2024. Supplementary Information (AIDRES, Table S4).
[63] J. W. Weibull. An introduction to evolutionary game theory. Technical Report Working Paper No. 347, The Industrial Institute for Economic and Social Research, 1992.
[64] World Bank. GDP (current US$). World Bank Open Data, 2025. Accessed: 2026-05-07.
[65] B. Yu, J. Fu, and Y. Dai. Multi-agent simulation of policies driving CCS technology in the cement industry. Energy Policy, 199:114527, 2025.
[66] Zero Emissions Platform (ZEP). Building a CO2 transport infrastructure for europe. Technical report, Zero Emissions Platform, 2011.
[67] T. Zhao and Z. Liu. A novel analysis of CCS technology adoption: An evolutionary game model. Energy, 189:116352, 2019.